cardiff-stage.fmg.ninja

320-420-9923

Investment

Bull & Bear Markets: A Timeline
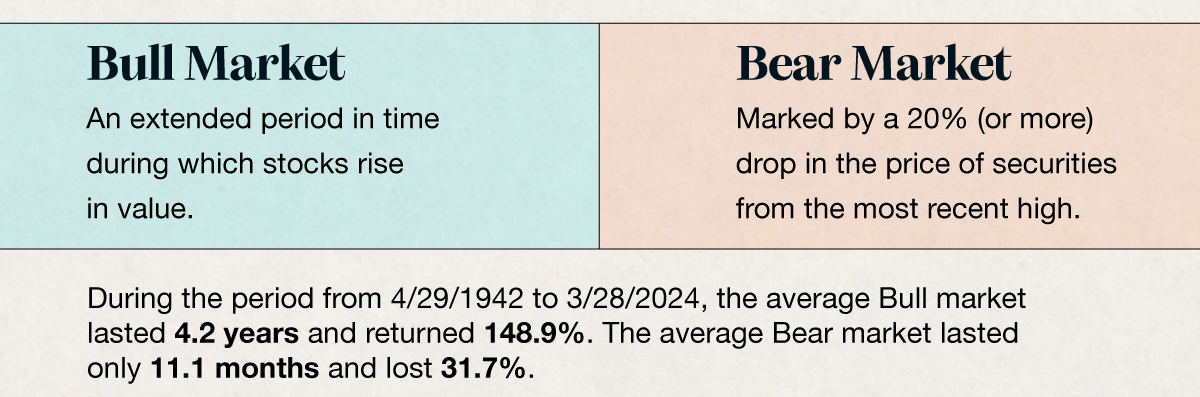
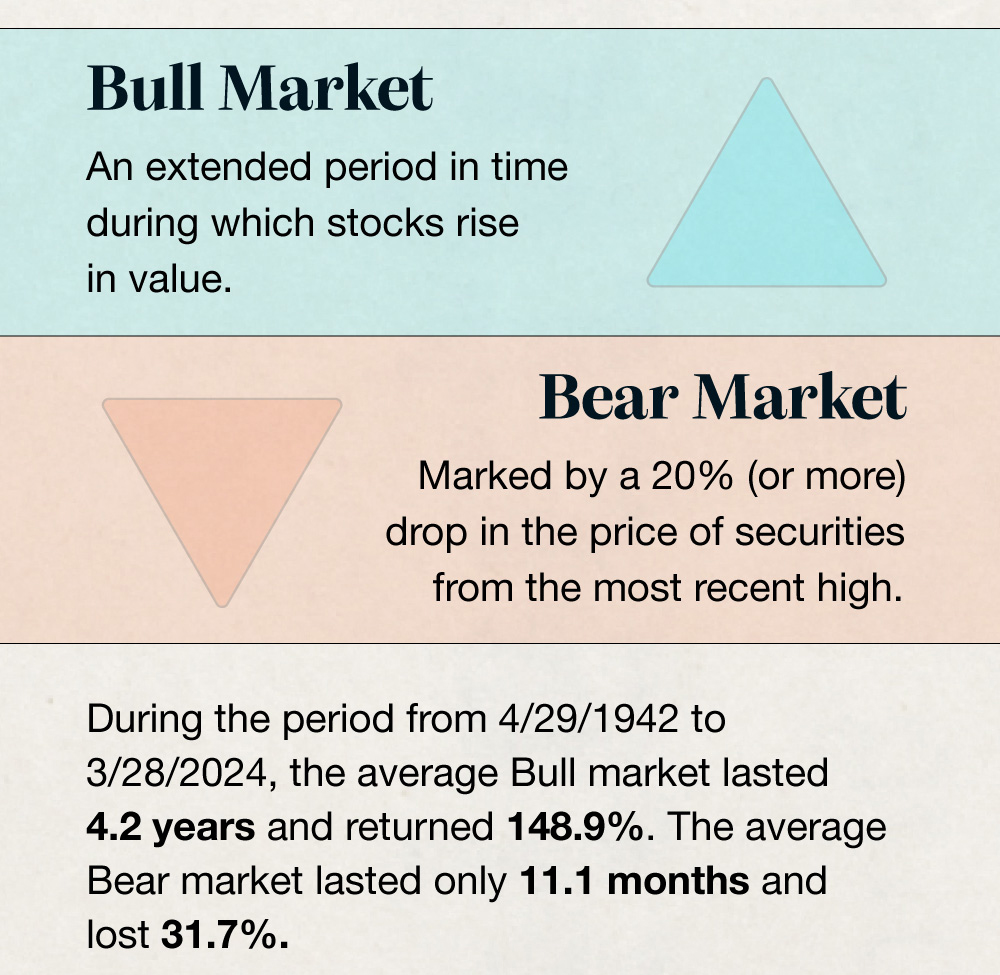
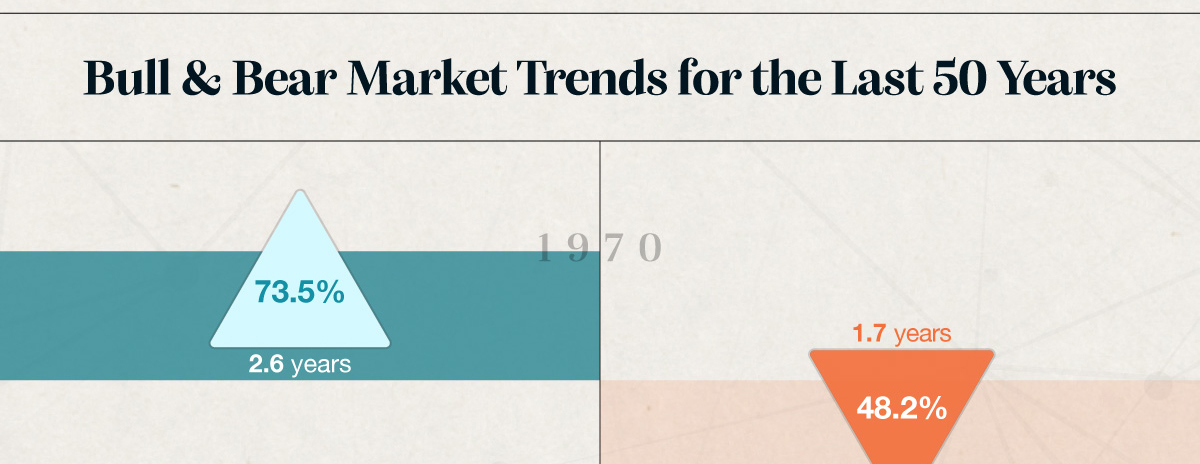
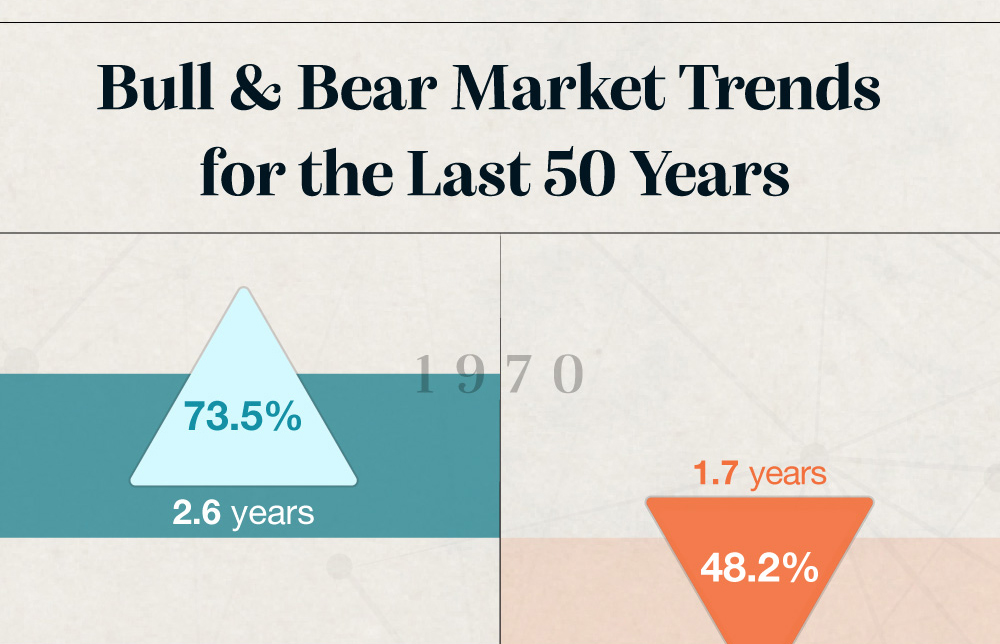
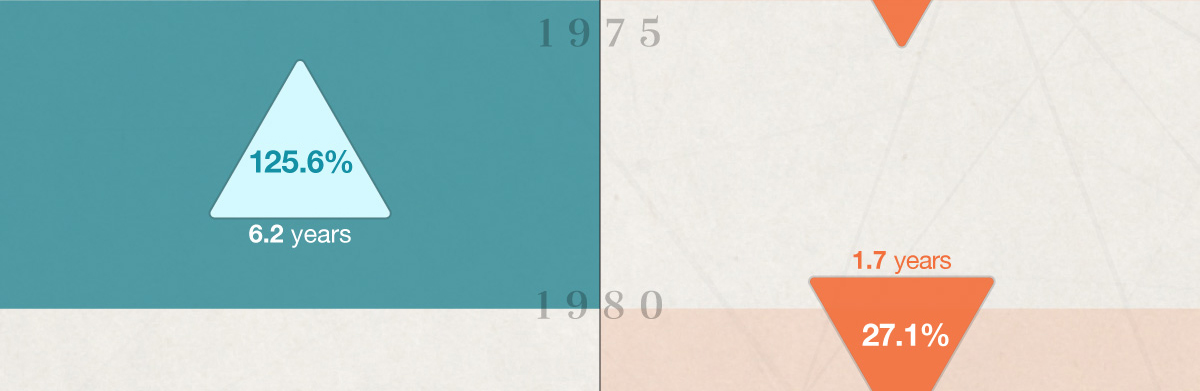
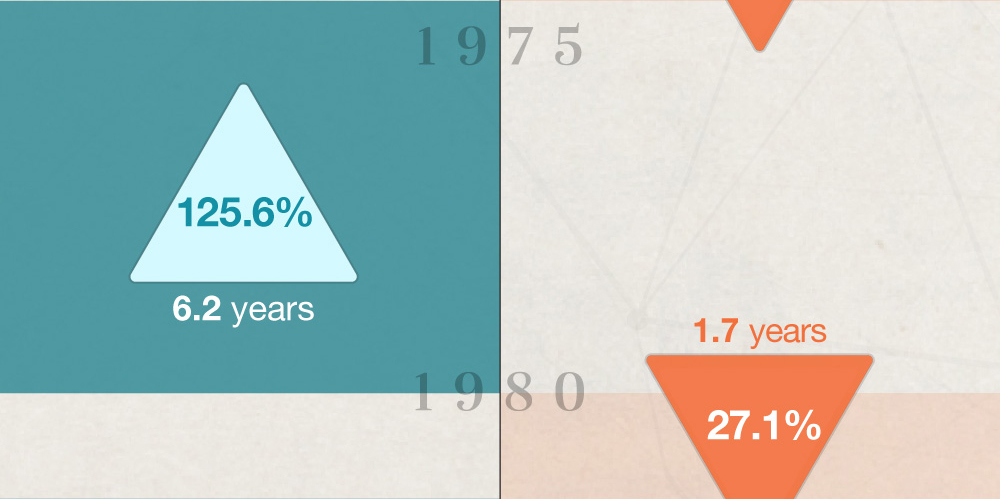
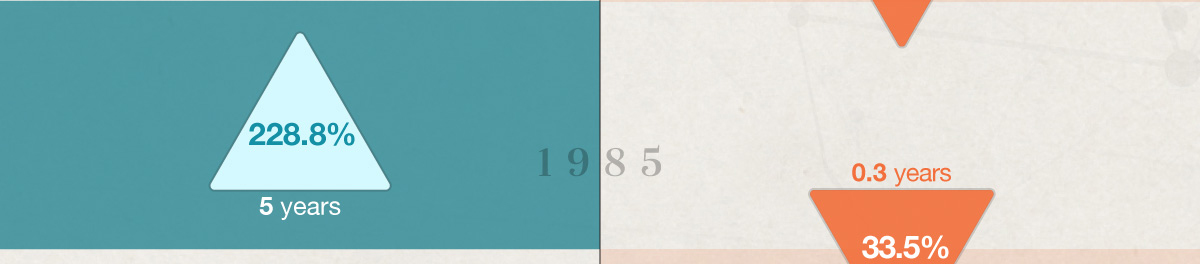
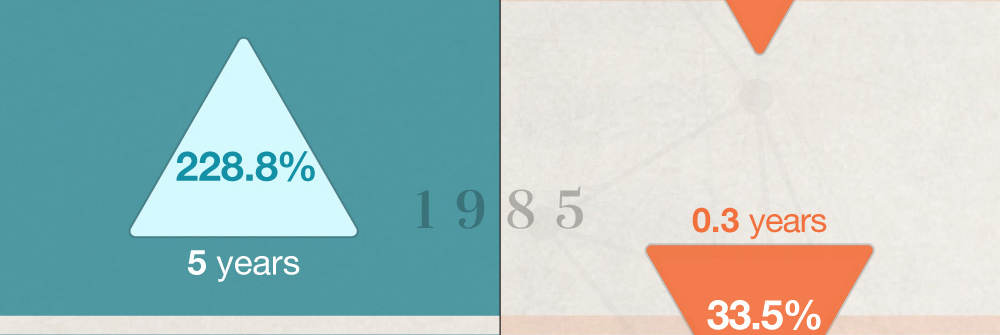
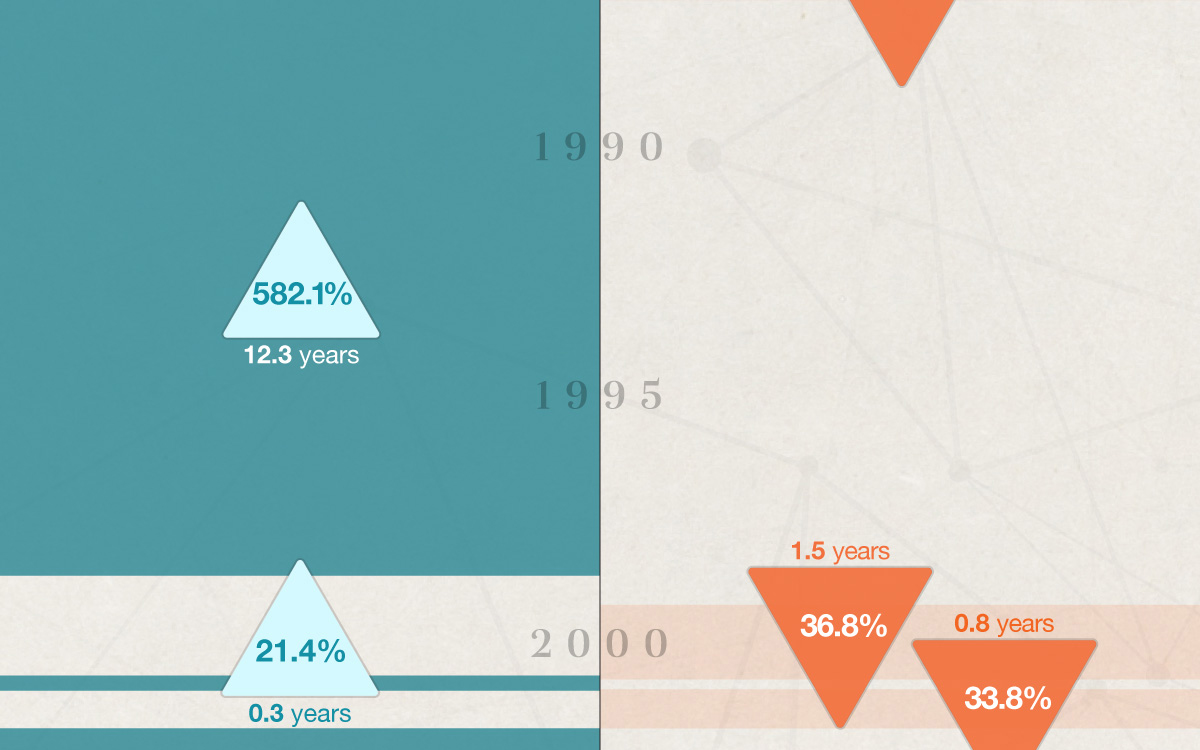
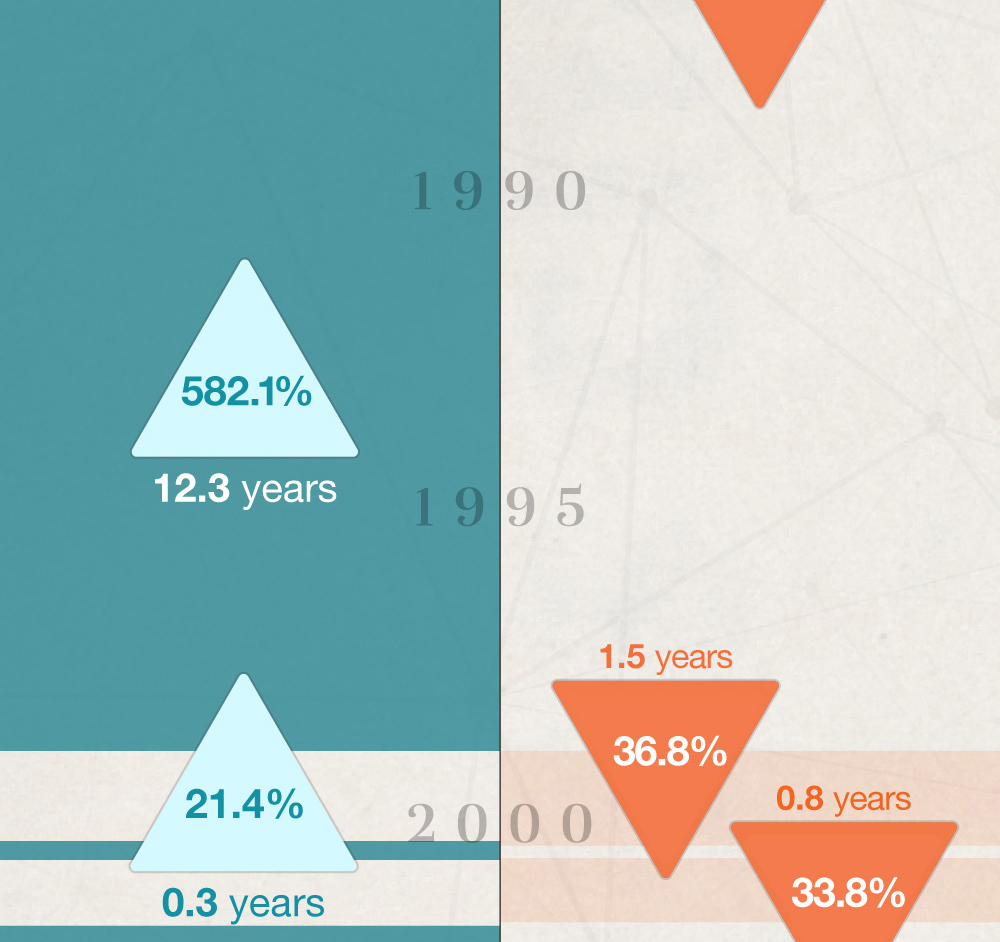
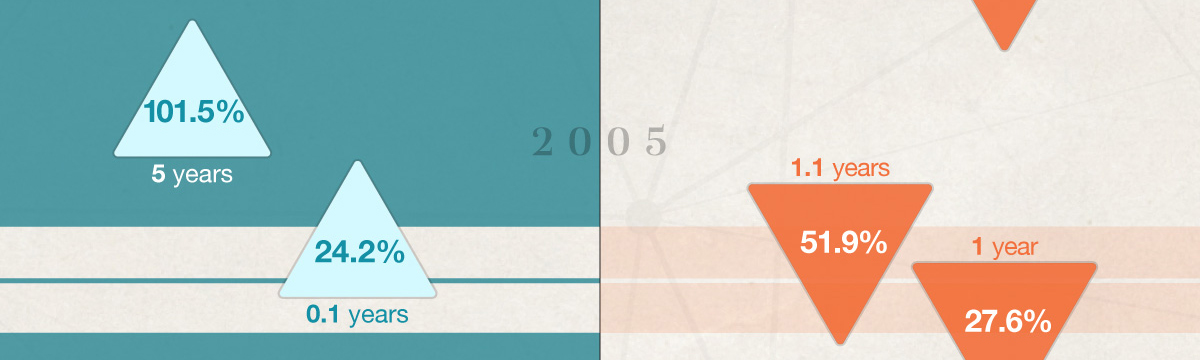
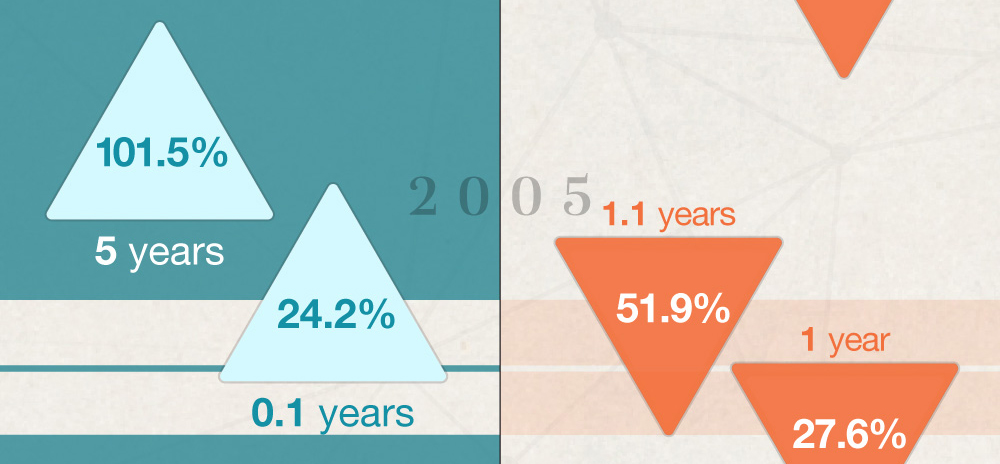
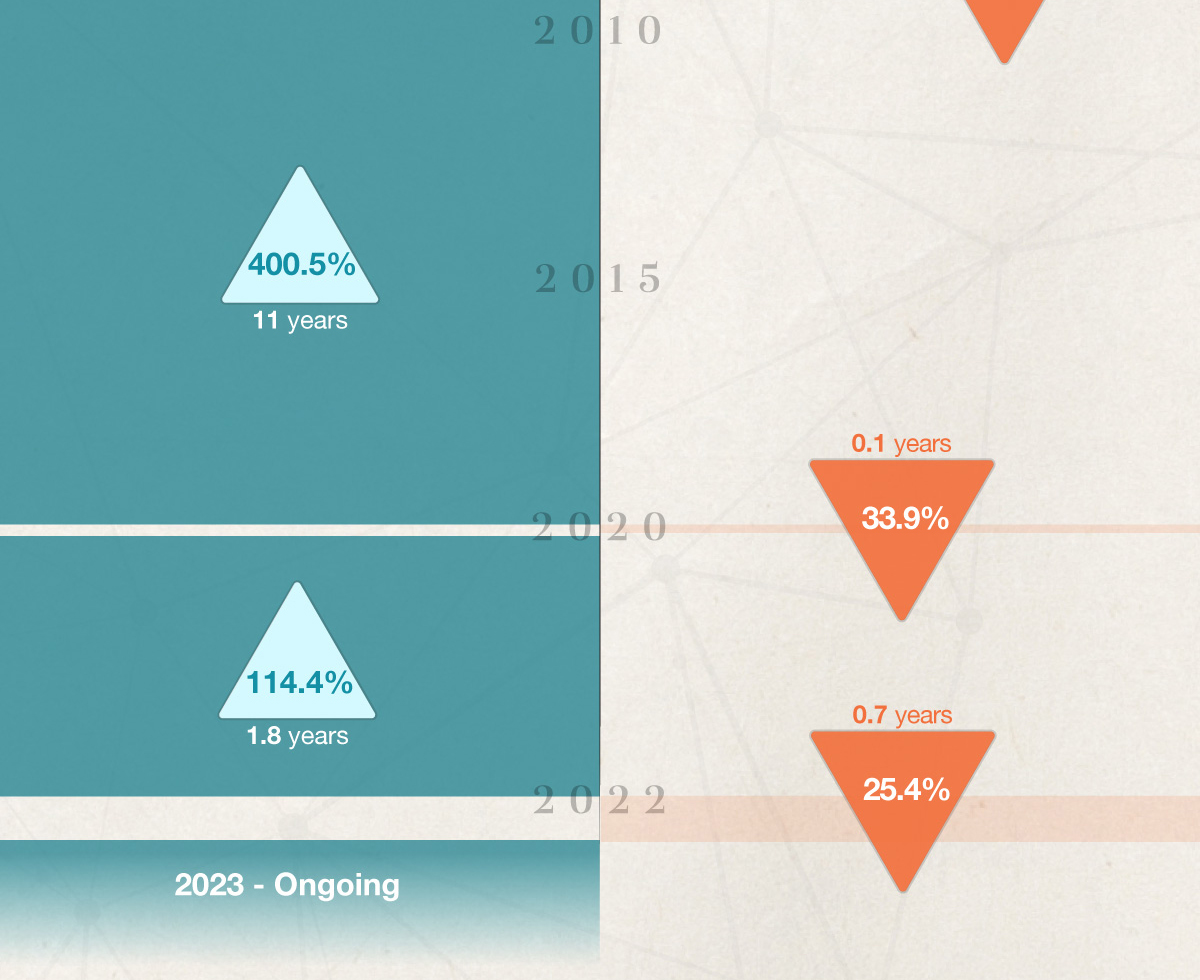
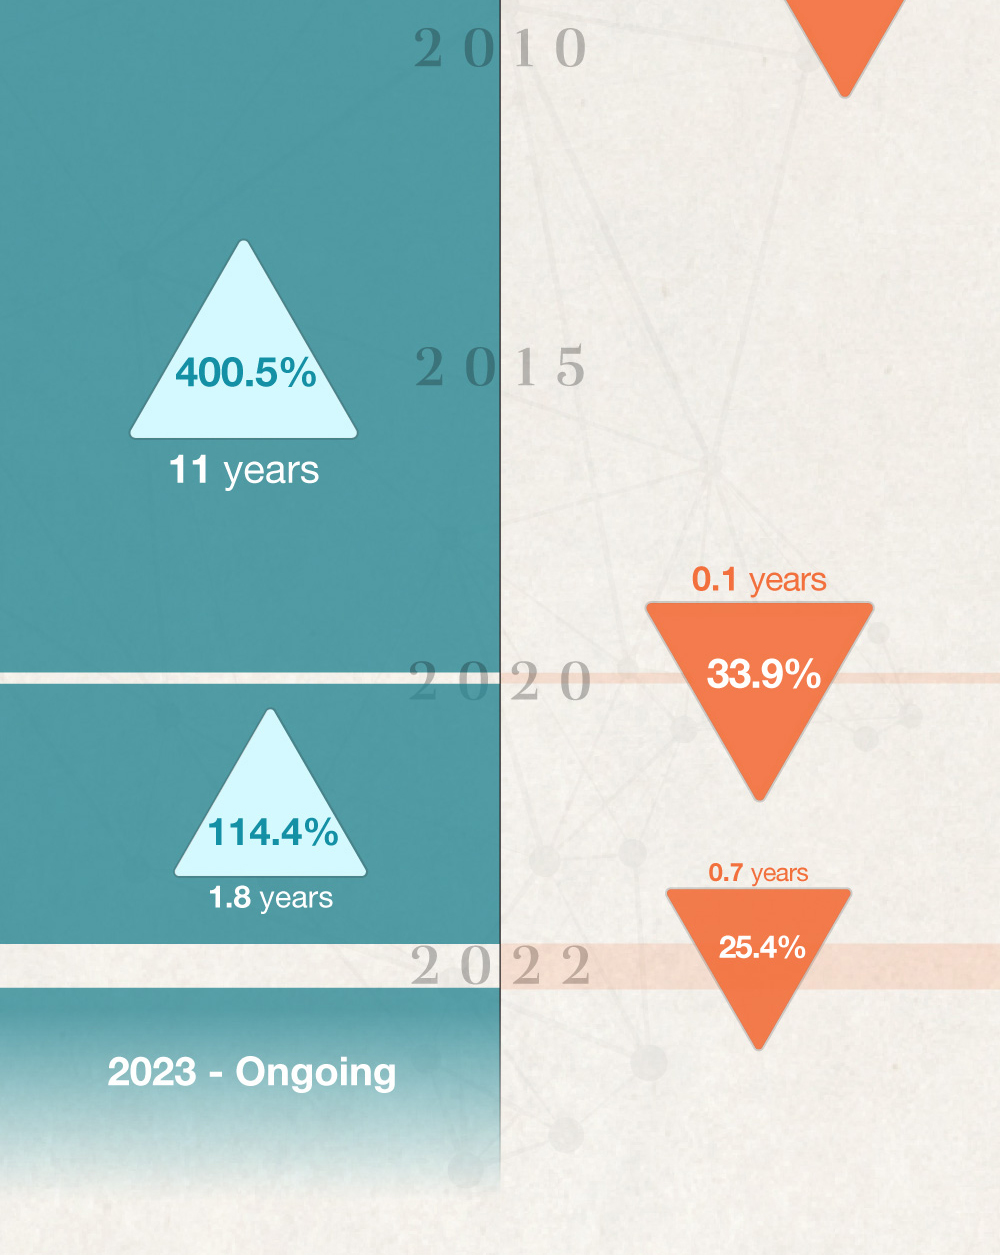
Bull & Bear Markets: A Timeline. Before 2020, the financial sector enjoyed one of the longest bull markets in history. Beginning in March 2009, the covid 19 pandemic ended this run in March 2020. However, recovery was swift, and a new bull market started in April that same year. As we face an uncertain road ahead, let's take a look at history's most recent bull and bear markets, as outlined by the S&P 500. Sources 1 and 2. Investing involves risks, and investment decisions should be based on your own goals, time horizon and tolerance for risk. The S&P 500 is an unmanaged index that is generally considered representative of the U.S. stock market. Index performance is not indicative of the past performance of a particular investment. Past performance does not guarantee future results. Individuals cannot invest directly in an index.Bull & Bear Markets: A Timeline. Before 2020, the financial sector enjoyed one of the longest bull markets in history. Beginning in March 2009, the covid 19 pandemic ended this run in March 2020. However, recovery was swift, and a new bull market started in April that same year. As we face an uncertain road ahead, let's take a look at history's most recent bull and bear markets, as outlined by the S&P 500. Sources 1 and 2. Investing involves risks, and investment decisions should be based on your own goals, time horizon and tolerance for risk. The S&P 500 is an unmanaged index that is generally considered representative of the U.S. stock market. Index performance is not indicative of the past performance of a particular investment. Past performance does not guarantee future results. Individuals cannot invest directly in an index.Bull Market: An extended period in time in which stocks rise in value. Bear Market: Marked by a 20% (or more) drop in the price of securities from the most recent high. The average Bull market lasted 52.8 months and returned 152.6 percent. The average Bear market lasted only 11.3 months and lost 32.1 percent.Bull Market: An extended period in time in which stocks rise in value. Bear Market: Marked by a 20% (or more) drop in the price of securities from the most recent high. The average Bull market lasted 52.8 months and returned 152.6 percent. The average Bear market lasted only 11.3 months and lost 32.1 percent.Bull & Bear Market Trends For the Last 50 Years. Starting in 1970, there was a 73.5 percent increase over the course of 2.6 years. Starting in 1973, there was a 48.2 percent decrease over the course of 1.7 years.Bull & Bear Market Trends For the Last 50 Years. Starting in 1970, there was a 73.5 percent increase over the course of 2.6 years. Starting in 1973, there was a 48.2 percent decrease over the course of 1.7 years.Starting in 1974, there was a 125.6 percent increase over the course of 6.2 years. Starting in 1980, there was a 27.1 percent decrease over the course of 1.7 years.Starting in 1974, there was a 125.6 percent increase over the course of 6.2 years. Starting in 1980, there was a 27.1 percent decrease over the course of 1.7 years.Starting in 1982, there was a 228.8 percent increase over the course of 5 years. Starting in 1987, there was a 33.5 percent decrease over the course of .3 years.Starting in 1982, there was a 228.8 percent increase over the course of 5 years. Starting in 1987, there was a 33.5 percent decrease over the course of .3 years.Starting in 1987, there was a 582.1 percent increase over the course of 12.3 years. Starting in 2000, there was a 36.8 percent decrease over the course of 1.5 years. Starting in 2001, there was a 21.4 percent increase over the course of .3 years. Later that same year, there was a 33.8 percent decrease over the course of .8 years.Starting in 1987, there was a 582.1 percent increase over the course of 12.3 years. Starting in 2000, there was a 36.8 percent decrease over the course of 1.5 years. Starting in 2001, there was a 21.4 percent increase over the course of .3 years. Later that same year, there was a 33.8 percent decrease over the course of .8 years.Starting in 2002, there was a 101.5 percent increase over the course of 5 years. Starting in 2007, there was a 51.9 percent decrease over the course of 1.1 years. Starting in 2008, there was a 24.2 percent increase over the course of .1 years. Later that same year, there was a 27.6 percent decrease over the course of 1 year.Starting in 2002, there was a 101.5 percent increase over the course of 5 years. Starting in 2007, there was a 51.9 percent decrease over the course of 1.1 years. Starting in 2008, there was a 24.2 percent increase over the course of .1 years. Later that same year, there was a 27.6 percent decrease over the course of 1 year.Starting in 2009, there was a 400.5 percent increase over the course of 11 years. Starting in 2020, there was a 33.9 percent decrease over the course of .1 years. There’s been an ongoing increase since 2020.Starting in 2009, there was a 400.5 percent increase over the course of 11 years. Starting in 2020, there was a 33.9 percent decrease over the course of .1 years. There’s been an ongoing increase since 2020.Source 1: CaptiveInternational.com, 2021. Source 2: Yardeni.com, 2022. The content is developed from sources believed to be providing accurate information. The information in this material is not intended as tax or legal advice. It may not be used for the purpose of avoiding any federal tax penalties. Please consult legal or tax professionals for specific information regarding your individual situation. This material was developed and produced by FMG Suite to provide information on a topic that may be of interest. FMG, LLC, is not affiliated with the named broker-dealer, state- or SEC-registered investment advisory firm. The opinions expressed and material provided are for general information, and should not be considered a solicitation for the purchase or sale of any security.Source 1: CaptiveInternational.com, 2021. Source 2: Yardeni.com, 2022. The content is developed from sources believed to be providing accurate information. The information in this material is not intended as tax or legal advice. It may not be used for the purpose of avoiding any federal tax penalties. Please consult legal or tax professionals for specific information regarding your individual situation. This material was developed and produced by FMG Suite to provide information on a topic that may be of interest. FMG, LLC, is not affiliated with the named broker-dealer, state- or SEC-registered investment advisory firm. The opinions expressed and material provided are for general information, and should not be considered a solicitation for the purchase or sale of any security.
 

Related Content

Retiring the 4% Rule

Retiring the 4% Rule

A portfolio created with your long-term objectives in mind is crucial as you pursue your dream retirement.

Top 5 Things to Tell Your Financial Pro

Top 5 Things to Tell Your Financial Pro

Here are the top 5 things your team may want to hear.

The Many Ways to Measure Inflation

The Many Ways to Measure Inflation

Different inflation indexes may tell different stories. Here's what that could mean for you.


Have A Question About This Topic?


Thank you! Oops!

Making Sense Of A Home Warranty

Understanding the value of a home warranty.

IRA Withdrawals that Escape the 10% Tax Penalty

The list of IRA withdrawals that may be taken without incurring a 10% early penalty has grown.

Tax Deductions You Won't Believe

Here are some examples of deductions from the IRS that were permitted and some that were, uh, too creative.

View all articles

How Can I Save a Million Dollars?

See what it takes in monthly contributions and time to reach a million-dollar savings goal.

Inflation & Retirement

See how inflation over time could affect the purchasing power of your retirement income.

How Much Home Can I Afford?

Estimate how much home may fit within your budget based on income and expenses.

View all calculators

An Arm and a Leg

A visit to the hospital can be painful, for both your body and your wallet. Don't let it be more painful than it has to be.

What Can a Million Dollars Buy You?

$1 million in a diversified portfolio could help finance part of your retirement.

Bursting the Bubble

Tulips were the first, but they won’t be the last. What forms a “bubble” and what causes them to burst?

View all videos